A. Cell Contents - You must select one of these statistics to be displayed in each cell of your table.
- Unweighted Number of Responses - The number of people that provided a particular answer for the survey item.
- Weighted Number of Responses - The weighted number of people that provided a particular answer for the survey item.
These are additional statistics that you may choose to display in each of the cells of your table.
-
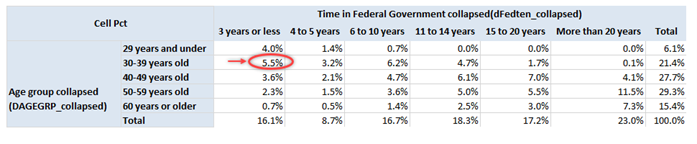
Cell Percentage - Percent of the total observations for a single cell. The circled percent shown below is a cell percentage. The circled percent indicates that respondents aged 30-39 years old with Federal Government tenure of 3 years or less make up 5.5% of the total number of respondents. The upper left cell indicates this is a cell percentage. Also, the bottom right cell (Total x Total) will always equal 100% when a cell percentage is chosen.
-
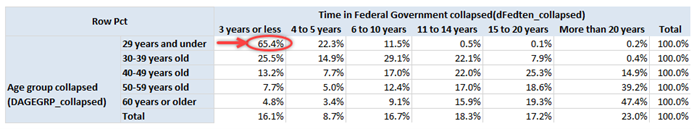
Row Percentage - Percent of observations using the row total as the total number of observations. The circled percentage shown below is a row percent. The circled percentage indicates that 65.4% of the respondents aged 30-39 years old have been with the Federal Government for 3 years or less. The upper left cell indicates this is a row percentage. The last column (total) will always equal 100% when a row percentage is chosen.
-
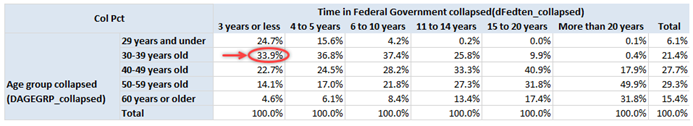
Column Percentage - Percent of observations using the column total as the total number of observations. The circled percent shown below is a column percent. The circled percent indicates that 33.9% of the respondents who have been with the Federal Government for 3 years or less are aged 30-39 years old. The upper left cell indicates this is a column percentage. The last row (total) will always equal 100% when a column percentage is chosen.
B. Output Options - Optional statistics you can request to include in your output.
- Confidence Interval (95% CI) - A confidence interval is also sometimes referred to as a margin of error. The confidence interval specifies the size of the interval that is expected to contain the true population value of the survey item of interest. Typically, a 95% confidence interval is used - meaning that the true value of the survey item will be contained in this interval 95 percent of the time.
- Chi-Square (RS2 and RS3) - RS2 and RS3 chi-square tests are special types of chi-square tests that are used when the data are weighted. The purpose of the test and the way in which the chi-square statistic are interpreted are the same as with the PEARSON chi-square.
- Standard Error - The standard error (S.E.) provides an estimation of the extent to which the statistic drawn from a sample differs from the population statistic. The smaller the standard error, the better the sample statistic is as an estimate of the population statistic. The standard error is a measure of sampling error; it refers to error in the estimate due to random fluctuation in the sample.
C. Missing Values - A value may be missing for a survey item if one or more of the following conditions is true:
- The respondent does not answer the survey item (i.e., " Missing Data") or is never provided with the opportunity to answer the survey item (i.e., a skip pattern has occurred)
- The respondent indicates he/she does not know the answer, or the survey item is not applicable to him/her (i.e., "Do Not Know/No Basis to Judge")